

Executive Summary: The $2 Million Trap on Your Warehouse Floor
Walk into any mid-to-large distribution center or manufacturing plant today, and you will witness an unspoken tug-of-war between two senior executives.
The Chief Financial Officer (CFO) looks at stacks of corrugated boxes, high-density racking, and raw material pallets, and sees a massive graveyard of dead cash. To the finance desk, every pallet is trapped liquidity that could otherwise fuel R&D, market expansion, debt reduction, or technology modernization.
The Supply Chain Director (VP of SCM) looks at the exact same pallets and sees security. To the logistics operations desk, that buffer represents protection against supplier delivery delays, container port congestion, sudden raw material spikes, and angry B2B enterprise customers threatening SLA penalty clauses.
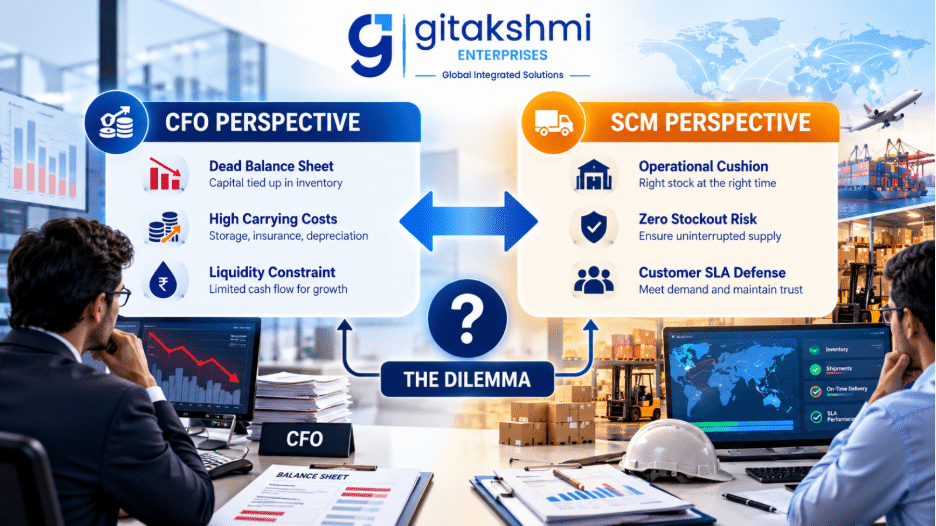
For decades, enterprises managed this tension by oscillating between two extremes:
- The Lean / Just-in-Time (JIT) Purists: Keep zero excess buffers; demand suppliers deliver exactly when the assembly line calls.
- The “Just-in-Case” Safety Stock Hoarders: Over-index on warehouse square footage; stockpile 60 to 90 days of inventory to hedge against uncertainty.
Both legacy extremes fail enterprise operations in 2026.
With borrowing costs fluctuating, interest rates staying sticky, geopolitical shipping routes rerouting, and carrying costs surging beyond 28% to 32% per annum, running a rigid inventory playbook is a silent margin killer.
Achieving liquidity without risking operational failure requires abandoning binary choices. High-performing manufacturing and enterprise distribution networks now deploy a dynamic hybrid model—one that blends JIT execution for high-velocity parts with algorithmic safety stock buffers for critical components.
The Hidden Mathematics: The True Cost of Holding Inventory in 2026
Most balance sheets reflect inventory as a current asset. However, from an operational and cash flow standpoint, excess inventory behaves much more like a depreciating liability.
When leadership calculates inventory carrying costs, they frequently underestimate the figure, defaulting to an outdated standard of 12% to 15%. In the current industrial environment, enterprise holding costs break down into four distinct categories:
1. Capital Cost (Weighted Average Cost of Capital – WACC)
- Average impact: 9% – 14%
- Money locked in warehouse aisles is capital not deployed elsewhere. If your corporate cost of capital or short-term working capital credit facility sits at 9% to 11%, holding an unnecessary $10,000,000 in safety stock directly strips $900,000 to $1,100,000 out of operating free cash flow every year.
2. Physical Storage & Facility Overhead
- Average impact: 6% – 9%
- Industrial warehouse leases, material handling equipment (MHE) amortization, racking, pallet maintenance, climate-control utilities, and floor space utilization. If your facility runs at 90%+ capacity due to sluggish stock, warehouse productivity plunges while labor handling costs double due to congestion.
3. Inventory Service & Administration Costs
- Average impact: 3% – 5%
- Comprehensive enterprise insurance, local inventory taxes, compliance fees, recurring physical cycle counts, and security protocols.
4. Operational Risk & Shrinkage (The Depreciation Spiral)
- Average impact: 5% – 8%
- Expiration, damage during redundant handling, pilferage, and design obsolescence. In sectors such as electronics, pharmaceuticals, and fast-moving retail, components that sit idle across three fiscal quarters often suffer inventory write-downs of 40% to 70% of book value.
- Takeaway: Holding $5,000,000 in excess buffer inventory silently extracts $1,400,000 in pure cash drain from the enterprise every single year.
JIT (Just-in-Time) vs. Safety Stock: A Comparative Breakdown
To balance the system, enterprise teams must understand where each operational philosophy delivers value and where each model breaks down under real-world logistics stress.
| Performance Attribute | Pure Just-in-Time (JIT) Model | Traditional Safety Stock Model | 2026 Predictive Dynamic Buffer |
| Working Capital Impact | Maximum cash unlocked; zero dead inventory | Massive cash trapped on balance sheet | Capital dynamically assigned by SKU tier |
| Warehouse Footprint | Minimal staging floors; rapid dock-to-line turns | High square-footage footprint, high racking density | Flexible flex-capacity hubs via integrated 3PL networks |
| Lead Time Vulnerability | Critical; single transit delay halts lines | Low; cushions against supplier tardiness | Proactive; reroutes and restocks dynamically |
| Supplier Relationship | Requires tight digital EDI/API transparency | Transactional; bulk purchase discounts | Strategic; Vendor Managed Inventory (VMI) + live portals |
| Carrying Cost Drag | Very low (3% – 6%) | Severe (25% – 34% annually) | Optimized (10% – 14%) |
| Demand Volatility Shock | High risk of stockouts during demand spikes | High risk of inventory obsolescence | Algorithmic reorder triggers match real consumption |
The Lean Pitfall: Why Pure JIT Proved Fragile
Originating from the renowned Toyota Production System (TPS), JIT was engineered under specific operational conditions: highly disciplined regional supply clusters, predictable transport transit times, and stable daily assembly line outputs.
When Western and global enterprises imported JIT into extended transcontinental supply lines, they omitted a fundamental prerequisite: supply chain visibility.
When international container shipping routes face disruptions, border inspections back up, or domestic freight lanes tighten, a pure JIT operation collapses within 48 to 72 hours. The cost savings gained from running lean can be eliminated by a single day of plant downtime or six-figure emergency air-freight expedites.
As explored in our analysis on the death of traditional SCM and the need for autonomous logistics, legacy lean frameworks fail without continuous data integration across every transportation and inventory milestone.
The Safety Stock Pitfall: The Complacency Cushion
Frightened by stockouts, many operations teams overcorrected by building permanent inventory cushions. However, static safety stock creates a dangerous operational illusion:
- The Bullwhip Amplifier: Static safety buffers distort true demand signals upstream. Tier-1 and Tier-2 suppliers over-produce, triggering price volatility and artificial shortages.
- The Obsolete SKU Graveyard: Inventory safety buffers configured on spreadsheets in Q1 frequently become obsolete dead-stock by Q4 due to product revisions and shifting buyer requirements.
- The Facility Congestion Penalty: A warehouse filled to 95% capacity requires workers to double-handle pallets just to locate daily picking bins. Labor expenses surge while dock-to-stock throughput drops.
The 2026 Solution: Dynamic Buffer Optimization & The ABC-XYZ Matrix
High-performing enterprise supply chains avoid applying a single inventory policy across their entire product catalog. A uniform rule—such as “hold 30 days of safety stock across all items”—is fundamentally flawed.
Instead, companies deploy the ABC-XYZ Inventory Segmentation Framework, which groups SKUs by financial impact and demand predictability:

Breakdown of the Quadrants:
1. The AX Class: The Pure JIT Engines
- Profile: High contribution to gross revenue, highly predictable and steady consumption rate.
- Capital Policy: Aggressive JIT. Do not tie up capital in weeks of safety stock.
- Execution: Implement automated supplier pull signals (electronic Kanban), multi-day deliveries, or line-side staging straight from inbound docks.
2. The AY & BY Class: The Dynamic Safety Stock Domain
- Profile: High-to-medium balance sheet revenue, but subject to seasonal swings, promotional cycles, or volatile supplier lead times.
- Capital Policy: Dynamic Safety Stock (DSS). Buffers are not fixed in stone; algorithms recalibrate safety levels weekly based on current lead-time variances and consumption patterns.
3. The CZ Class: The Working Capital Traps
- Profile: Low revenue contribution and highly unpredictable demand (e.g., spare components, niche variants).
- Capital Policy: Make-to-Order (MTO), vendor-owned consignment, or rationalized out of the product catalog entirely. Keeping months of CZ components in high-cost warehouse space drains enterprise liquidity.
The Dynamic Safety Stock Formula (Moving Beyond Static Spreadsheets)
Legacy logistics operations rely on static formulas:
Safety Stock = Z × σL × D
This basic formula breaks down because it assumes supplier lead times never fluctuate and demand follows a neat, normal distribution. In 2026, enterprise systems apply a more comprehensive model accounting for simultaneous variance in both supplier fulfillment and customer demand:
Dynamic Safety Stock = Z × √[ (L_avg × σD²) + (D_avg² × σL²) ]
Where:
- Z (Service Factor): The inverse cumulative normal distribution score corresponding to your target SLA (e.g., 95% = 1.65, 98% = 2.05, 99% = 2.33).
- L_avg: Average lead time from the supplier (in days or weeks).
- σL: Standard deviation of supplier lead time (measuring supplier unreliability).
- D_avg: Average demand per period.
- σD: Standard deviation of customer demand volume.
How the Dynamic Formula Works (Step-by-Step)
| Step | Input / Calculation Stage | What It Measures |
| 1. Demand Variance | Customer order swings (σD) | Captures unexpected spikes or drops in buyer demand |
| 2. Lead Time Variance | Supplier delay swings (σL) | Captures transit delays, port congestion, or supplier unreliability |
| 3. Combined Statistical Variance | √[ (Avg_Lead × σD²) + (Avg_Demand² × σL²) ] | Merges both demand and supply uncertainties into a single risk score |
| 4. SLA Multiplier | Multiplied by Desired Service Factor (Z) | Adjusts buffer size based on your target fulfillment guarantee (e.g., 98%) |
| 5. Final Output | Dynamic Safety Stock Requirement | Exact safety buffer needed—automatically recalibrated without overstocking |

What This Formula Demonstrates to Leadership:
Notice the second half of the equation: (D_avg² × σL²).
When supplier transit times are volatile (σL is large), safety stock requirements increase exponentially.
Rather than simply stockpiling more inventory, CFOs and supply chain leaders can reduce working capital demands by choosing reliable supply chain partners, stabilizing distribution transit times, and leveraging centralized multi-location logistics control models to keep lead-time standard deviations near zero.
5 Practical Steps to Free Up Working Capital in 2026
If your goal is to reclaim $500,000 to $5,000,000 in trapped working capital across your network within the next two quarters, execute this operational roadmap:
Step 1: Audit and Isolate “Dead Weight” Inventory
Run a rigorous inventory aging report. Any SKU that has not registered an inventory turn across 120+ days represents locked liquidity.
Classify slow-moving inventory into three groups:
- Repurpose/Bundle: Package with high-velocity SKUs at slight promotional incentives to liquidate inventory into cash.
- Supplier Buy-Back / Return-to-Vendor: Exercise contract clauses for credit on overstocked parts.
- Scrap / Write-Down: Take the balance sheet write-down to capture corporate tax offsets, and immediately reclaim physical square footage.
Step 2: Implement Multi-Echelon Inventory Optimization (MEIO)
Enterprises managing multiple regional distribution hubs often store duplicate safety stock buffers in every building.
By shifting from decentralized safety stocks to a centralized hub-and-spoke inventory architecture, aggregate buffer requirements typically drop by 25% to 40% without diminishing regional fulfillment speeds. Centralized visibility makes this coordination possible, as detailed in our guide to integrated 3PL and smart warehousing networks.
Step 3: Transition High-Cost Components to VMI (Vendor Managed Inventory)
Require strategic tier-1 suppliers to maintain ownership of inventory until it is pulled into active production or prepped for customer dispatch.
Under a modern VMI or consignment framework:
- The inventory physically sits inside an integrated warehousing and specialized staging hub.
- The balance sheet records zero carrying cost until the precise moment of stock consumption.
- The supplier benefits from long-term purchase agreements and live consumption visibility.
Step 4: Shorten Upstream Order Lead Times
Carrying costs are downstream consequences of lengthy lead times. Shrinking procurement transit times by 40% automatically reduces required safety buffers:
- Shift single-source offshore dependencies to domestic or nearshore alternatives.
- Contract with logistics partners capable of streamlined cross-docking and direct line-side deliveries.
- Standardize SKU packaging specifications to speed up dock-to-stock turnaround times.
Step 5: Replace Static Spreadsheets with Connected Control Towers
Static spreadsheets are obsolete upon export. Replace disconnected Excel-based safety stock formulas with integrated enterprise visibility portals that connect inventory levels, inbound transit milestones, and purchase orders in real time.
Working Capital Transformation: Before and After
The operational and financial impact of modernizing an inventory strategy can be seen in typical mid-market enterprise metrics:
| Operational Metric | Legacy “Just-in-Case” Operation | Modern Dynamic Optimization | Bottom-Line Impact |
| Total Inventory Value | $14,200,000 | $9,600,000 | $4,600,000 Cash Released |
| Annual Carrying Cost (at 28%) | $3,976,000 | $2,688,000 | $1,288,000 Direct Annual Savings |
| Cash Conversion Cycle (CCC) | 78 Days | 46 Days | 32 Days Faster Liquidity |
| Order Fill Rate (SLA) | 94.2% (Frequent Stockouts) | 99.1% | Higher Retention & Revenue |
| Warehouse Space Utilization | 94% (Congested / Overflow) | 74% (Clean / High-Velocity) | Zero External Overflow Leases |
How Gitakshmi Enterprises Bridges the JIT vs. Safety Stock Divide
Executing an agile, low-cost inventory strategy is difficult if your enterprise relies on fragmented warehouse spaces, disconnected transport carriers, and legacy manual handling systems.
Gitakshmi Enterprises serves as an operational execution partner for high-growth enterprises, industrial manufacturers, and B2B distributors seeking to free up cash flow without sacrificing service levels.
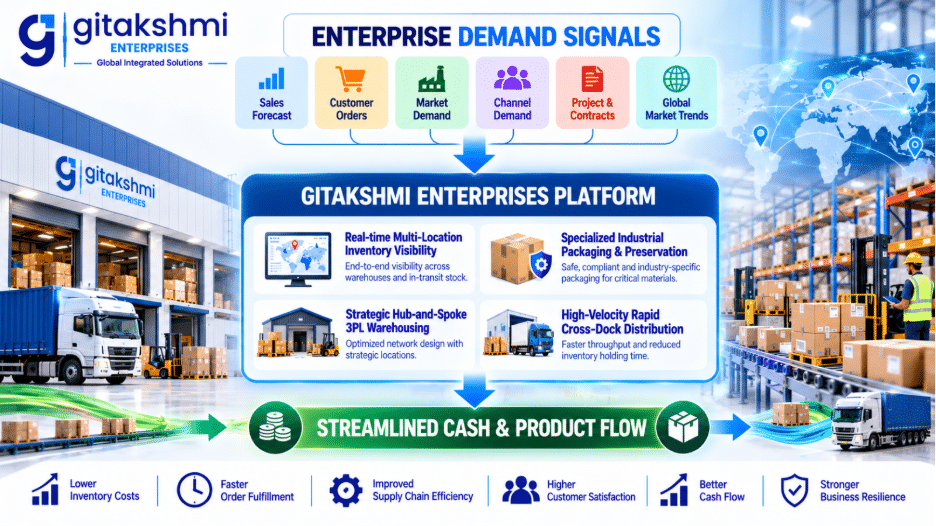
1. Strategic 3PL & Multi-Location Regional Hubs
Gitakshmi Enterprises provides modular, scalable warehousing infrastructure across critical trade corridors. Instead of locking capital into 10-year facility leases, companies leverage our flexible footprints to position inventory closer to target markets—lowering transit times and cutting safety stock requirements. Explore our smart 3PL logistics networks.
2. Centralized Logistics Management & Visibility
Operating blind invites safety stock bloat. Gitakshmi connects your operational milestones through centralized logistics oversight, giving procurement and distribution teams real-time inventory visibility. Discover how we implement centralized multi-location control models.
3. Industrial Packaging & Preservation Engineering
Inventory value drops when components suffer degradation or damage in storage. Gitakshmi integrates custom industrial packaging, weather-proofing, and automated kitting directly within the warehouse, preserving balance sheet value and streamlining dock-to-line transitions. Read more about our integrated warehousing and packaging solutions.
The JIT vs. Safety Stock Decision Matrix
Use this quick-reference matrix when reviewing SKU lines with your planning teams:
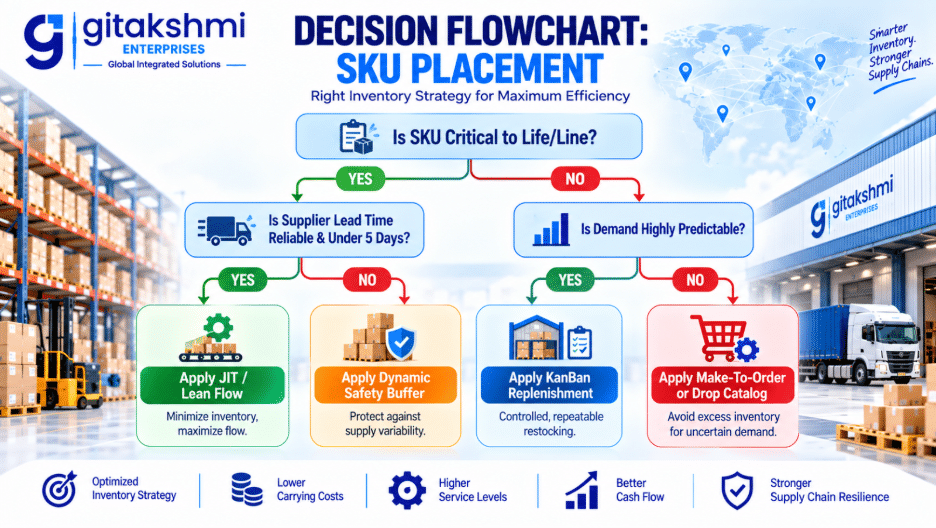
- Adopt Pure JIT if:
- Suppliers are geographically proximate or have contracted line-side delivery guarantees.
- Demand volatility for the finished unit is low (CoV < 0.20).
- Carrying costs for the SKU family exceed 30% per annum.
- Stockout penalties are manageable without factory-wide shutdowns.
- Adopt Dynamic Safety Stock if:
- Global logistics routes or customs clearance points present potential transit variance.
- Production downtime costs exceed $20,000 per hour.
- Lead times average longer than 15 business days.
- Bulk transportation volume breaks justify controlled staging runs.
Conclusion: Balancing the Balance Sheet in 2026
The historical debate between lean Just-in-Time models and traditional Safety Stock buffers was built on a false premise: that an enterprise must choose between financial liquidity and operational safety.
In 2026, market leaders achieve both.
By categorizing inventory profiles, replacing static buffers with dynamic formulas, and partnering with integrated logistics providers like Gitakshmi Enterprises, supply chain leaders eliminate the need to tie up millions in idle inventory.
Unlocking your company’s balance sheet begins with an objective inventory audit. Examine your racking, review the carrying cost mathematics, and replace dead warehouse stock with an agile logistics network built for today’s market realities.
Optimize Your Inventory & Capital Strategy with Gitakshmi Enterprises
Looking to evaluate your multi-location warehousing architecture, streamline safety stock allocations, or optimize your distribution logistics?
- Talk to an Infrastructure Strategist: Contact Gitakshmi Enterprises
- Explore Our Core Logistics Capabilities: Integrated Warehousing & Logistics Solutions

Recent Posts